Our Strategic Blueprint
I took on the CEO role last year because I see QuantumScape as the global leader in solid state battery technologies with an ability to revolutionize energy storage and create tremendous shareholder value in the process.
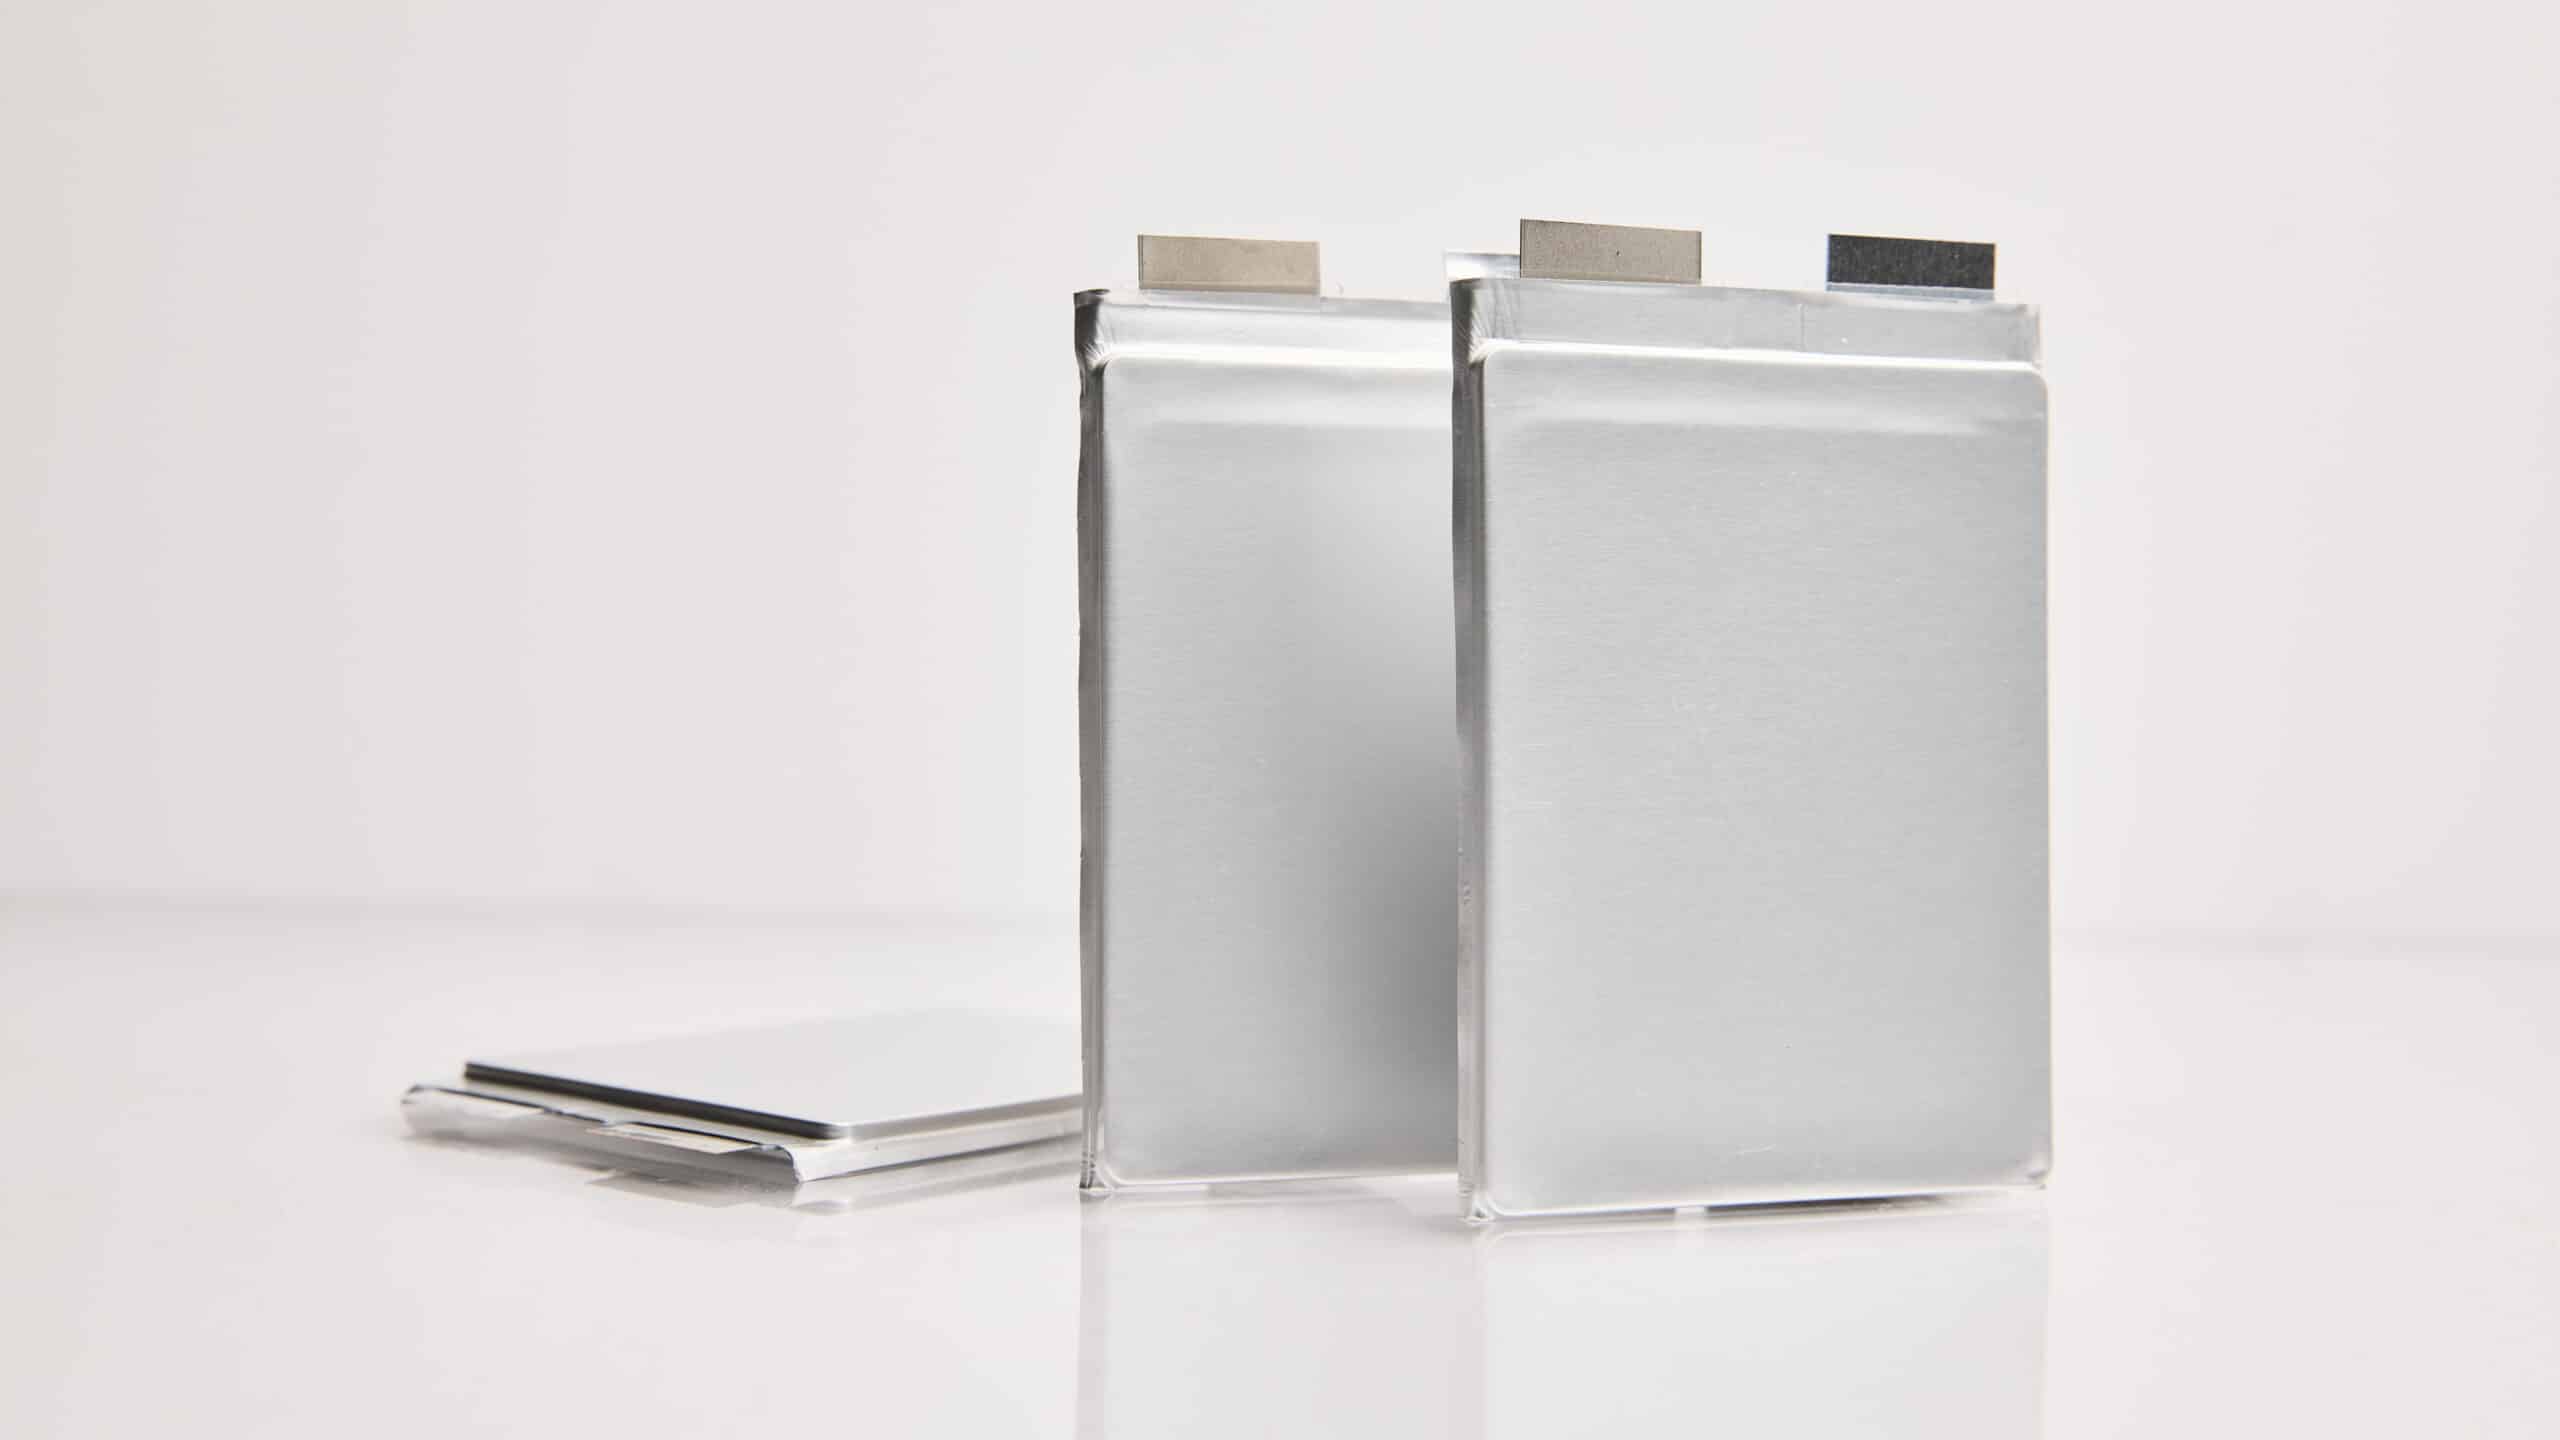
QuantumScape’s planned first commercial product, QSE-5, is a ~5 amp-hour cell designed to meet the requirements of automotive applications. Here, we’ll walk through the various elements of the cell specifications and explain some of the complexities behind the seemingly simple metric of energy density.
ENERGY DENSITY: More than a single number
For those who follow the battery industry, it can feel like there’s a constant stream of headlines about new batteries with record-breaking energy densities. However, it is much rarer for those headlines to provide the context necessary to make sense of the numbers. Energy density cannot be evaluated in an apples-to-apples comparison from battery to battery without knowing factors such as cell size and weight, discharge rate, temperature, state of charge and operating pressure.
Let’s start with the basic data: The QSE-5 B-sample cell has a measured cell energy of 21.6 Watt-hours (Wh) at C/5 discharge rate and 25 °C. This is divided by the cell volume to get the volumetric energy density of 844 Wh/L or by the cell mass to get the gravimetric energy density (also called specific energy) of 301 Wh/kg.
The story doesn’t end there, though. First, some batteries are designed to optimize for either higher power or higher energy density, which affects the energy density of a given cell. But even beyond this, there is a larger set of questions that must be answered before energy density can be meaningfully compared from one cell to another. Let’s walk through those questions one by one.
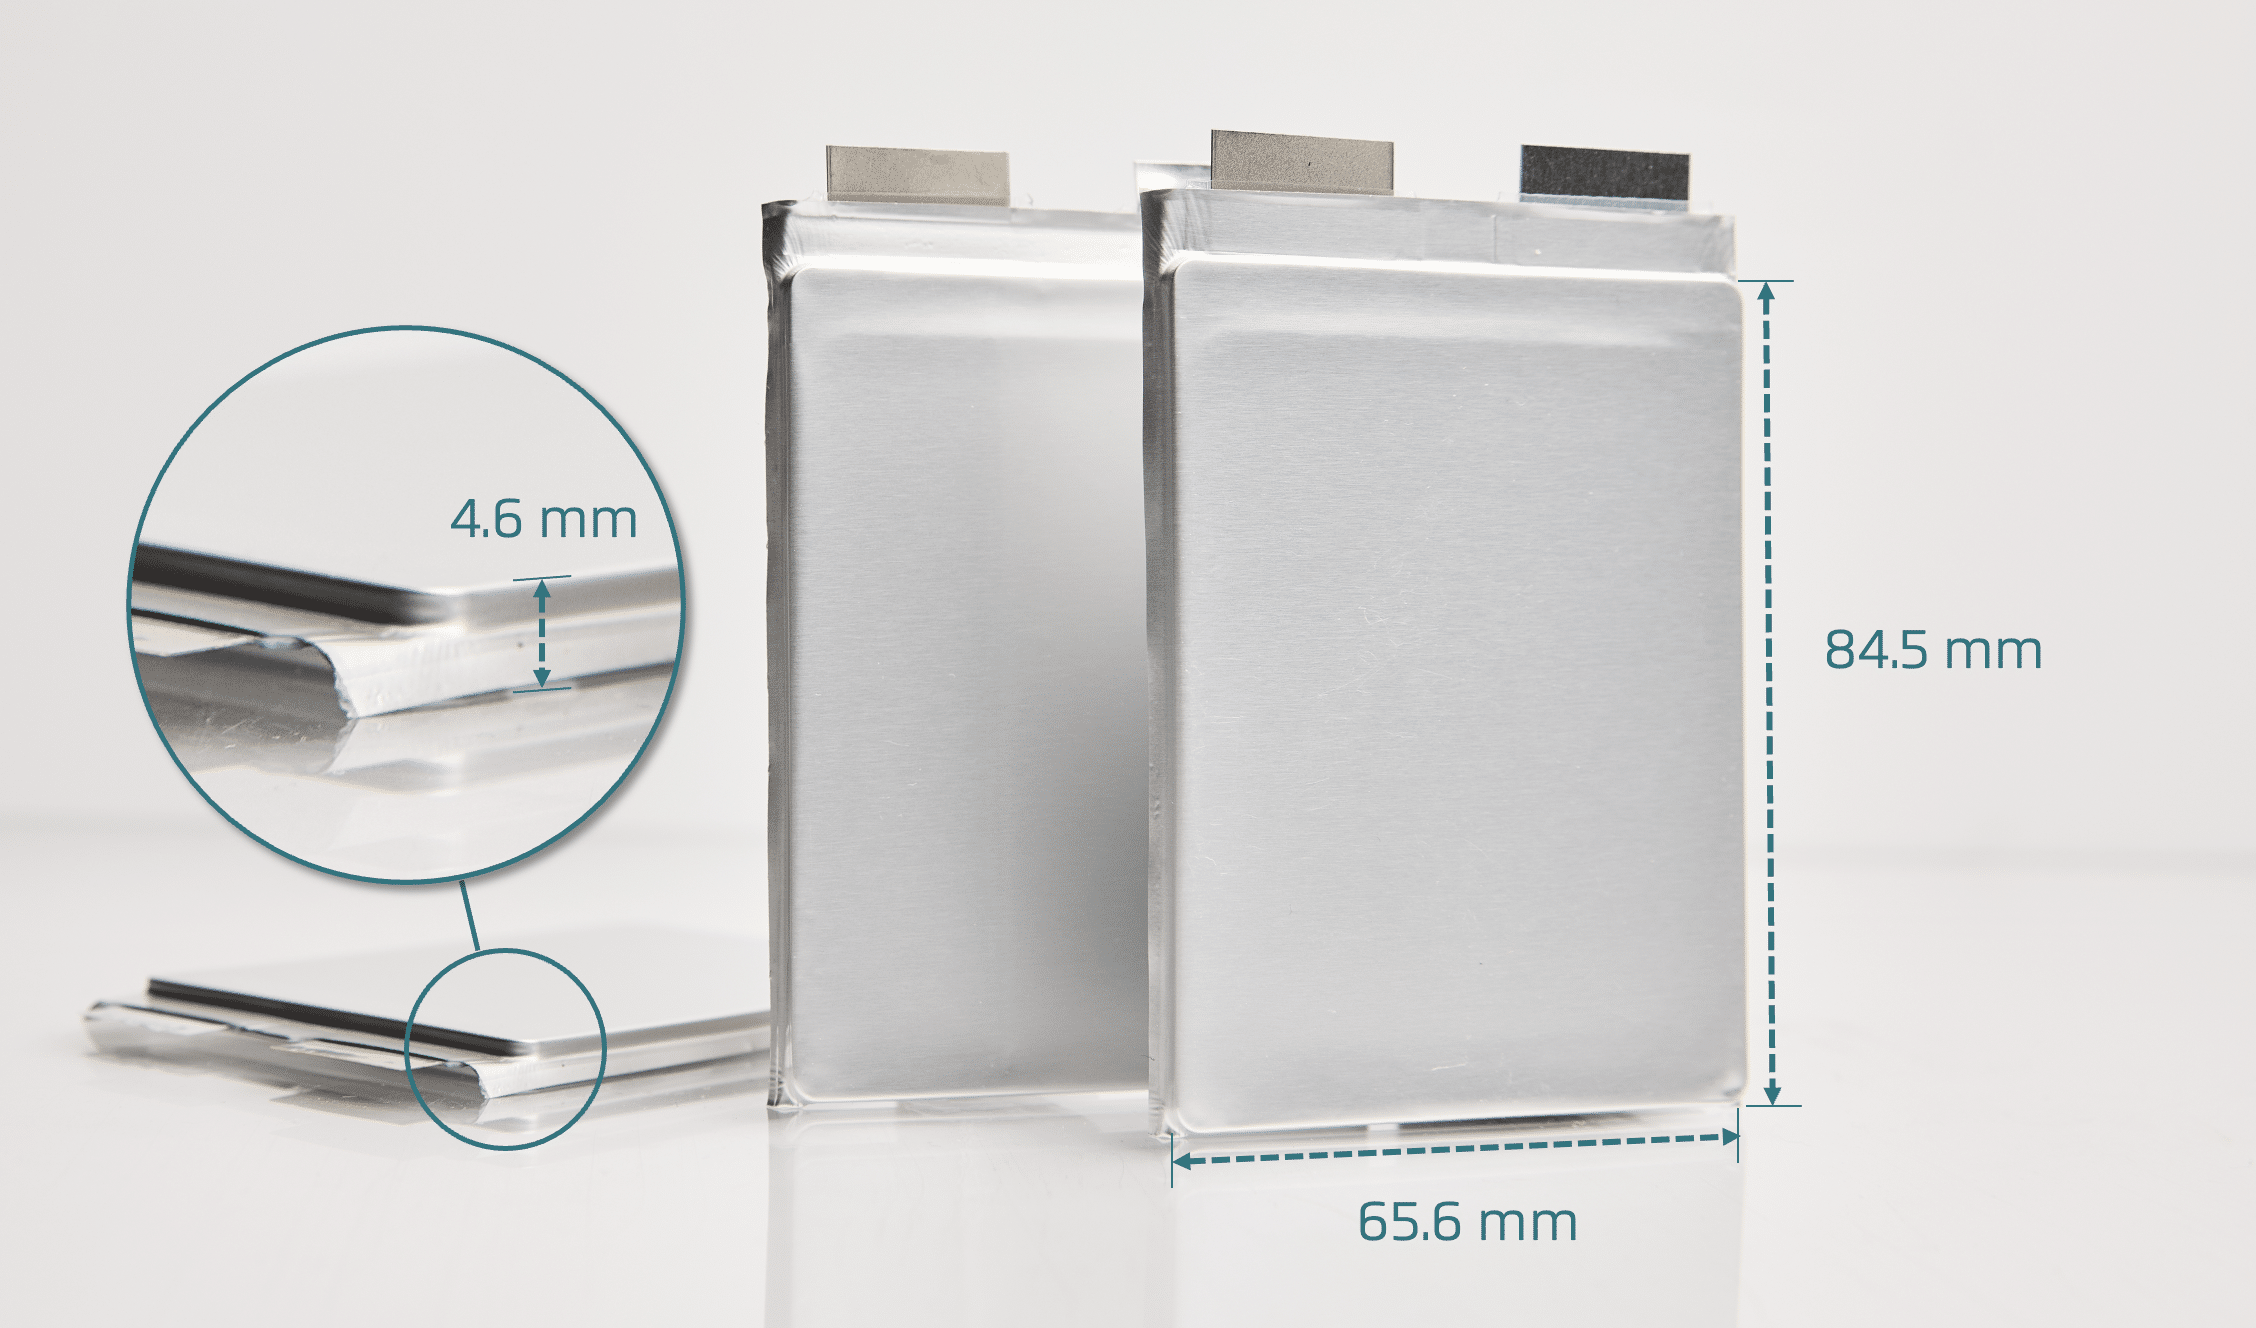
Cell dimensions
The cell dimensions of the QSE-5 are measured using an actual physical QSE-5 cell sample, not based on projections or models. Many battery developers take a smaller version of their commercial cell design and project what the energy density would be if scaled up to a larger format with better packaging efficiency, but those projections are based on assumptions that may not turn out to be accurate. When evaluating energy density claims, always ask whether the numbers you see are projections about possible future products or measurements of the actual cells.
Some reports of energy density relate only to the unpackaged active stack, which includes the electrodes and separator but not the outer packaging materials, but this is a little like reporting the calories in a sandwich without including the bread. Just like a sandwich, a commercial battery cell necessarily includes something to hold the whole package together. Since all commercial battery cells must be packaged in a can or pouch, active-stack energy density metrics are hard to interpret and may be misleadingly high. Accordingly, we measure energy density of a fully packaged cell.
Even with packaged cells, the format also matters: when measuring the volume of a cylindrical cell, for example, it is typical to include the whole cell can, whereas measurements of a pouch-type cell may exclude the thin tabbing area at the top or sides of the cell, since the tabs will be integrated into the larger module assembly. In keeping with this latter method, QSE-5 volume measurements exclude the top tabbing area above the frame, but include the folded laminate material on the other three edges.[1]
Last but not least, the volume of the cell depends on its state of charge. Even conventional batteries can swell by a few percent when fully charged; this effect is more pronounced in cells with silicon anodes, and in cells with lithium-metal anodes, the difference in volume between 0% and 100% state of charge (SoC) can be substantial. Importantly, if the cell volume is measured at 0% or 30% SoC, since the cell volume at low SoC is smaller, the volumetric energy density will also appear to be higher. But fundamentally, it doesn’t make sense to quote the energy density of a cell at 0% SoC, because when a cell is fully discharged, it isn’t storing any energy at all. We report QSE-5 energy density at 100% SoC, and we believe volumetric energy density should only be reported at 100% SoC so that the full impact of any swelling is accounted for.
Discharge rate
Our QSE-5 B sample has a measured discharge energy of 21.6 Wh. However, as with almost everything in batteries, energy can’t easily be reduced to one simple number. Many other things also affect how much energy a battery can deliver to the end user.
One underappreciated factor is that the discharge rate, which relates directly to vehicle acceleration, influences the measured nominal capacity, or the total amount of electrical charge a battery can store. A good rule of thumb is that the slower the discharge rate, the higher the capacity the battery can deliver. This means that if nominal capacity is defined using a very low discharge rate, energy density might appear to be higher on paper than in practice. That’s why it’s important that nominal capacity be determined using a discharge rate that is relevant to how the battery is likely to be used.
There is no universal standard discharge rate for EV batteries, but many EV battery companies report energy density using a rate of C/5 (five-hour discharge) to measure the nominal capacity. In the real world, this is roughly equivalent to driving 350 miles at 70 miles per hour.[2] We believe this is a good approximation of the application where vehicle range, and therefore energy density, matters most to drivers, and this is the C-rate we used for our published QSE-5 B sample specs.
If a lower C-rate were used, such as C/20 (20-hour discharge), this slower discharge rate would make cell energy density appear higher, and some cell makers have used rates this slow (or slower) to report their energy density. However, C/20 discharge would be equivalent to taking a 350-mile trip while driving just 17.5 miles per hour, which is not how people typically use their cars. So, when evaluating energy density claims, it’s always important to determine the discharge rate at which that energy density was measured and check whether it matches the intended application.
Temperature
We have written extensively about the impact temperature has on battery performance, and so it should be no surprise that it also can affect energy density. When it comes to solid-state batteries in particular, technologies such as polymer-based solid electrolytes often require elevated temperatures to overcome the ionic resistance of the solid electrolyte and deliver high energy density. A battery technology that offers high energy density at 60 °C but poor energy density at room temperature is not particularly useful for passenger electric vehicles. Energy density specifications should therefore always include the temperature at which the battery was discharged; in the case of the QSE-5 B sample, that figure is 25 °C (room temperature).
Operating pressure and packing efficiency
All lithium-ion batteries expand and contract as they are charged and discharged, but the modules or packs into which they are built typically do not. This means that the pressure the cell experiences will vary depending on state of charge, and the compressive force felt by the cell will impact its volume. In the case of QSE-5, the cell is designed to operate in a range below 3.4 atm applied pressure, and the volumetric energy density figure reflects the dimensions of the cell at 100% state of charge when built into a fixed-volume module.
The QSE-5 is in the FlexFrame format, a hybrid of conventional prismatic and pouch designs, which allows each cell to pack tightly next to its neighbor. Contrast this with the popular cylindrical format, which loses roughly 9% of its energy density when assembled into a pack volume due to fundamental cell geometry. This means that cell-level volumetric energy density figures for cylindrical cells somewhat overstate the system-level energy density that can be realized in a full vehicle pack.
The energy density checklist
While energy density is one of the most commonly reported battery metrics, there are complexities involved that cannot be reduced to one simple number. That’s why we created a helpful checklist as a guide to make it easier to evaluate the completeness and comparability of energy density claims.
| QSE-5 B Sample | |
|---|---|
| Are the figures measured or projected? | Measured figures |
| Is the cell fully packaged? | Fully packaged |
| Is any part of the cell excluded (tabs, etc.)? | Excluding tabbing area |
| At what state-of-charge was the volume measured? | 100% SoC |
| What is the discharge rate? | C/5 |
| What is the discharge temperature? | 25 °C |
| What is the operating pressure? | < 3.4 atm |
| What is the cell format? | FlexFrame |
In sum, the QSE-5 B sample represents a significant advancement in battery technology and an important milestone for QuantumScape. Its impressive topline energy density also provides an example of the importance of the individual factors that go into delivering energy density in automotive applications, such as the physical cell dimensions, discharge rate, temperature, and operating pressure.
[1] For completeness, our team also calculated QSE-5 B sample volume according to the United States Advanced Battery Consortium’s (USABC) Battery Test Manual For Electric Vehicles. This manual, used by the U.S. Department of Energy to evaluate battery technology performance and commercial viability, leverages the cell displacement volume (i.e., the volume a cell would displace when submerged in a body of fluid) in its energy density calculations. This method considers the volume of all battery components, including both the tabs and tabbing area. Using this approach, we measured a comparable (slightly higher) energy density for the QSE-5 B sample, providing an additional method to validate our energy density figure. The USABC method yielded a better energy density value because its volume calculation is not influenced by expected gaps induced during stiff laminate folding along our cell edge.
[2] Note that the actual vehicle range depends on both the total size of the pack and the efficiency of the vehicle, neither of which can be specified on a cell level.
Forward-Looking Statements
This article contains forward-looking statements within the meaning of the federal securities laws and information based on management’s current expectations as of the date of this current report. All statements other than statements of historical fact contained in this article, including statements regarding the future development of QuantumScape’s battery technology, the anticipated benefits of QuantumScape’s technologies and the performance of its batteries, and plans and objectives for future operations, are forward-looking statements. When used in this current report, the words “may,” “will,” “estimate,” “pro forma,” “expect,” “plan,” “believe,” “potential,” “predict,” “target,” “should,” “would,” “could,” “continue,” “believe,” “project,” “intend,” “anticipates” the negative of such terms and other similar expressions are intended to identify forward-looking statements, although not all forward-looking statements contain such identifying words.
These forward-looking statements are based on management’s current expectations, assumptions, hopes, beliefs, intentions, and strategies regarding future events and are based on currently available information as to the outcome and timing of future events. These forward-looking statements involve significant risks and uncertainties that could cause the actual results to differ materially from the expected results. Many of these factors are outside QuantumScape’s control and are difficult to predict. QuantumScape cautions readers not to place undue reliance upon any forward-looking statements, which speak only as of the date made. Except as otherwise required by applicable law, QuantumScape disclaims any duty to update any forward-looking statements. Should underlying assumptions prove incorrect, actual results and projections could differ materially from those expressed in any forward-looking statements. Additional information concerning these and other factors that could materially affect QuantumScape’s actual results can be found in QuantumScape’s periodic filings with the SEC. QuantumScape’s SEC filings are available publicly on the SEC’s website at www.sec.gov.
I took on the CEO role last year because I see QuantumScape as the global leader in solid state battery technologies with an ability to revolutionize energy storage and create tremendous shareholder value in the process.
QuantumScape’s planned first commercial product, QSE-5, is a ~5 amp-hour cell designed to meet the requirements of automotive applications. Here, we’ll walk through the various elements of the cell specifications and explain some of the complexities behind the seemingly simple metric of energy density.
Privacy Policy | Terms of Use
© 2025 QuantumScape Battery, Inc.
1730 Technology Drive, San Jose, CA 95110
info@quantumscape.com

Pamela Fong is QuantumScape’s Chief of Human Resources Operations, leading people strategy and operations, including talent acquisition, organizational development and employee engagement. Prior to joining the company, Ms. Fong served as the Vice President of Global Human Resources at PDF Solutions (NASDAQ: PDFS), a semiconductor SAAS company. Before that, she served in several HR leadership roles at Foxconn Interconnect Technology, Inc., a multinational electronics manufacturer, and NUMMI, an automotive manufacturing joint venture between Toyota and General Motors. Ms. Fong holds a B.S. in Business Administration from U.C. Berkeley and a M.S. in Management from Stanford Graduate School of Business.
